An Introduction to Climate Technology and Geoengineering
- Preface
- Basic Radiative Equilibrium
- Earth’s Energy Flows
- Addressing the Issue
Climate Technologies and Geoengineering
- Conclusion
- References
Preface
This essay intends to outline a simplified model of the Earth’s climate system, focusing on the simplest calculations required to understand how the Earth’s carbon cycle functions. After this explanation, I summarise the timescale and potential pathways to address the issue of global warming and finally, explore the exciting and innovative field of geoengineering and similar technologies aiming to reduce the Earth’s human-generated emissions.
A focus is placed on understanding the technical aspects of the field, not on political or social elements, despite those being crucial. This is not an attempt to detract from the importance of social and political aspects but is a result of my view that technology advancement will serve as a key lever for scalable solutions (and I find this more interesting to write about).
Hopefully this serves as a sufficiently-useful entry point to encourage further investigation and interest in related topics—this seems to be a topic of importance at this point in time and I believe that greater exposure to these ideas (in a simplified form) is critical to understanding and success in the future. Any views expressed here are mine only and do not reflect any current or former employer.
Basic Radiative Equilibrium
Don’t let this heading fool you—this section is the simplest possible climate model which incorporates all the essential physics behind Earth’s energy flows. This acts as a diving board for the key components that make up the Earth’s ‘Carbon Cycle’.
If the Earth’s temperature was to stay the same, we would expect that any heat coming into the system (our atmosphere) must be equivalent to the heat coming out. Makes sense right? Put 2 degrees in, take 2 degrees out and the overall temperature remains the same.
Taking a small step backwards, we will first calculate how the energy equilibrium is calculated, then convert this energy into a corresponding temperature. It’s the same result, we just require the inputs to be in energy before we can move on. We begin with sunlight. Solar flux, or concentrated sunlight, is a measure of how much light energy is being radiated in a given area. This flux is incident on a projected surface area of the Earth onto a place perpendicular to the Sun’s rays (equivalent to 1/4 of the Earth’s total surface area).
Solar Flux = 1360 Watts / Square Metre
Perpendicular Reflection Surface / Earth’s Total Surface Area = 0.25
The last component of this equation is the Earth’s albedo - this is a dimensionless measure of diffuse reflection of solar radiation, with zero being a black body that absorbs all radiation and one reflecting all incident radiation. This variable is identified below:
Earth’s Albedo (α) ≈ 0.30
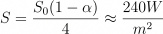
Bringing these together, we get a net incoming solar energy of:

The most basic physical constraint on climate is that of planetary energy balance, which says that this S must be balanced by outgoing thermal radiation, also known as ‘outgoing longwave radiation’, or OLR. This is estimated as a blackbody (idealised Earth) emission:

Where:
and T is the temperature in Kelvin for some ‘emission temperature’:

The equilibrium now looks like Incoming=Outgoing:

We can solve this equilibrium equation for the only unknown remaining, the equilibrium temperature T, coming out to 255 Kelvin. This is cold, around 18 degrees Celsius below zero. The Earth’s average global temperature is more like 288K, just below 15 degrees Celsius. The reason for the difference is the greenhouse effect.
The greenhouse effect
One major component left out of the equilibrium below was that of the greenhouse effect, the process whereby a certain fraction of infrared radiation is absorbed by the atmosphere on the way out and re-emitted back into the atmosphere.
At a highly simplified level: The sun’s rays heat the ocean and the greenhouse gases (particularly water vapour) in the lower atmosphere prevent the ocean from cooling itself, radiating most of the heat right back into the ocean (these are the red arrows below). The ocean ends up cooling through a process of evaporation occurring in the boundary layer (or BL), the bottom kilometre or so of atmosphere which is in close contact with the surface and is devoid of clouds. As the convecting air rises and cools, the vapour condenses and results in cloud and rain formation.
This condensation ends up heating the atmosphere, via the release of the same heat which was required in order to evaporate the water originally. This condensation heat, released at an altitude where the greenhouse effect is weak, is now able to radiate out into space unimpeded. Thus, Earth’s energy balance is not purely radiative (as calculated above) but is mediated by convection, with water vapour acting as a key middleman. We call this a state of radiative-convective equilibrium (or RCE).
The part of the atmosphere in RCE in which this mediation by convection occurs is known as the troposphere. This convection heating of the troposphere is related to the surface temperature of Earth and, combined with the two facts below, gets us much closer to the actual value of the earth’s balanced temperature:
Fact 1: The temperature of a convecting parcel of air decreases as it rises, at a characteristic rate of roughly 7 K/km.
Fact 2: To a good approximation, the temperature profile of the troposphere is simply that of a rising convecting parcel.
Assuming that radiative cooling occurs rather uniformly throughout the troposphere and using some physics (referenced at the bottom of this page), the final calculation reveals:

This result is incredibly close to the actual value of 288 K, outlined above. Furthermore, this equation tells us that this value stems from the radioactive energy balance of the planet (the first half of the equation) combined with the effects of convection on the temperature profile of the troposphere (the second half).
Earth’s Energy Flows
With an understanding of Earth’s basic energy balance and a corresponding model of RCE, my strategy for this next section is about illustrating how energy flows through the Earth’s system, specifically what factors were left out of the simplified system explained above, and getting the fundamentals down about how these flows have been altered since the Industrial Age.
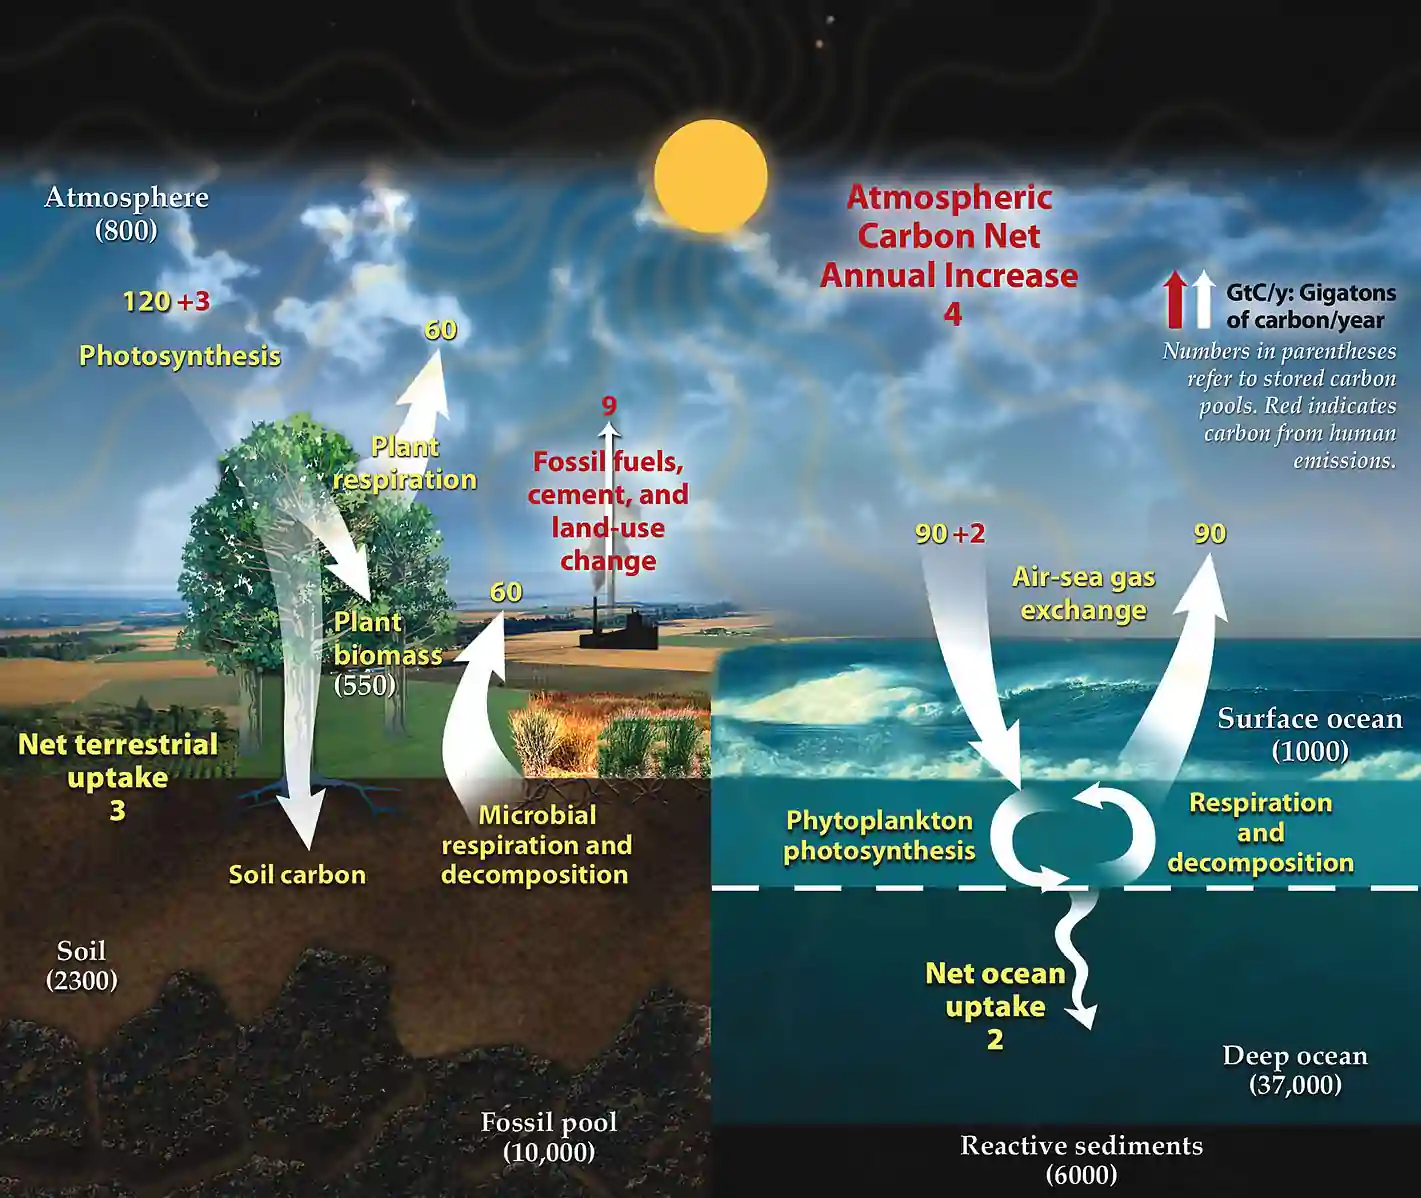
Let’s start with a diagram (slightly out-of-date on the exact numbers) which summarises the overall pattern of ongoing fluxes in the carbon cycle:
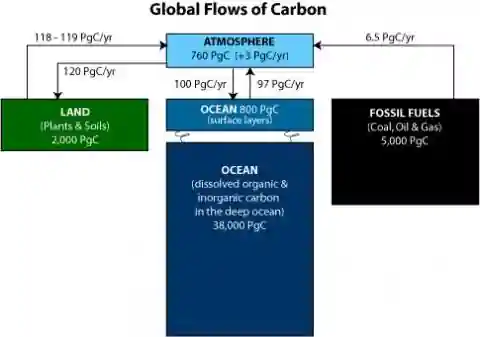
Let’s unpack a few factors which have not yet been discussed.
Land biology effects
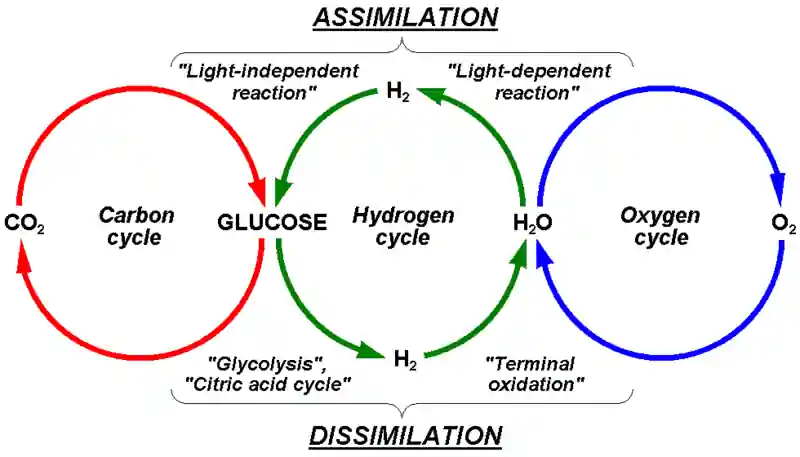
This is known as the terrestrial biological carbon cycle—most carbon in this category is stored by forests: they hold 86% of the planet’s terrestrial above-ground carbon. The biosphere energy exchange begins with photosynthesis.
Photosynthesis is the process whereby organic matter such as plants and trees (known as autotrophs) absorb carbon dioxide from the air, combine it with water and light, and produce carbohydrates. These carbohydrates function as the building blocks for growth and are the basic material that maintains the existing components of vital functions. Roughly half of the dry biomass of plants is made up of carbon molecules. This is the input we see into the green box above.
As plants grow, they lock in carbon as part of the accumulation of biomass. In trees, approximately half of the carbon bound in photosynthesis is used for construction of new biomass. Part of this is allocated to long-lived stem, branches and roots; the rest shed seasonally as fruits, needles, branches or bark. This biomass is the green box itself, the carbon storage.
The slow decomposition (the collection of processes whereby micro-organisms break down biodegradable material in the absence of oxygen), of both the fallen biomass and the plant itself, releases carbon dioxide back into the atmosphere. Thus, as plants die, this organic material is deposited as sediment and can eventually enter the geosphere through tectonic processes and remain there for several million years. This process leads to the creation of fossil fuel.
This decomposition is not the only carbon output of the organic matter—some of the carbon returns back to the atmosphere are respired carbon dioxide from plants as well as soil microbiota. Respiration is the basic cellular process to obtain chemical energy from the oxidation of organic molecules, and CO2 results as a waste product of the overall metabolism. Generally, about half of the caught carbon is released in respiration.
Overall, the biological turnover is almost exactly in balance over a year, just not perfectly so at any location and instant of time (this is outside the scope of this essay).
In addition, it’s worth noting that if there is a persistent net imbalance, like if atmospheric CO2 concentration levels increase (providing plants with more CO2), this will cause increased growth rates or mass of plant matter. This is a significant positive feedback loop which could exert large effects on the climate.
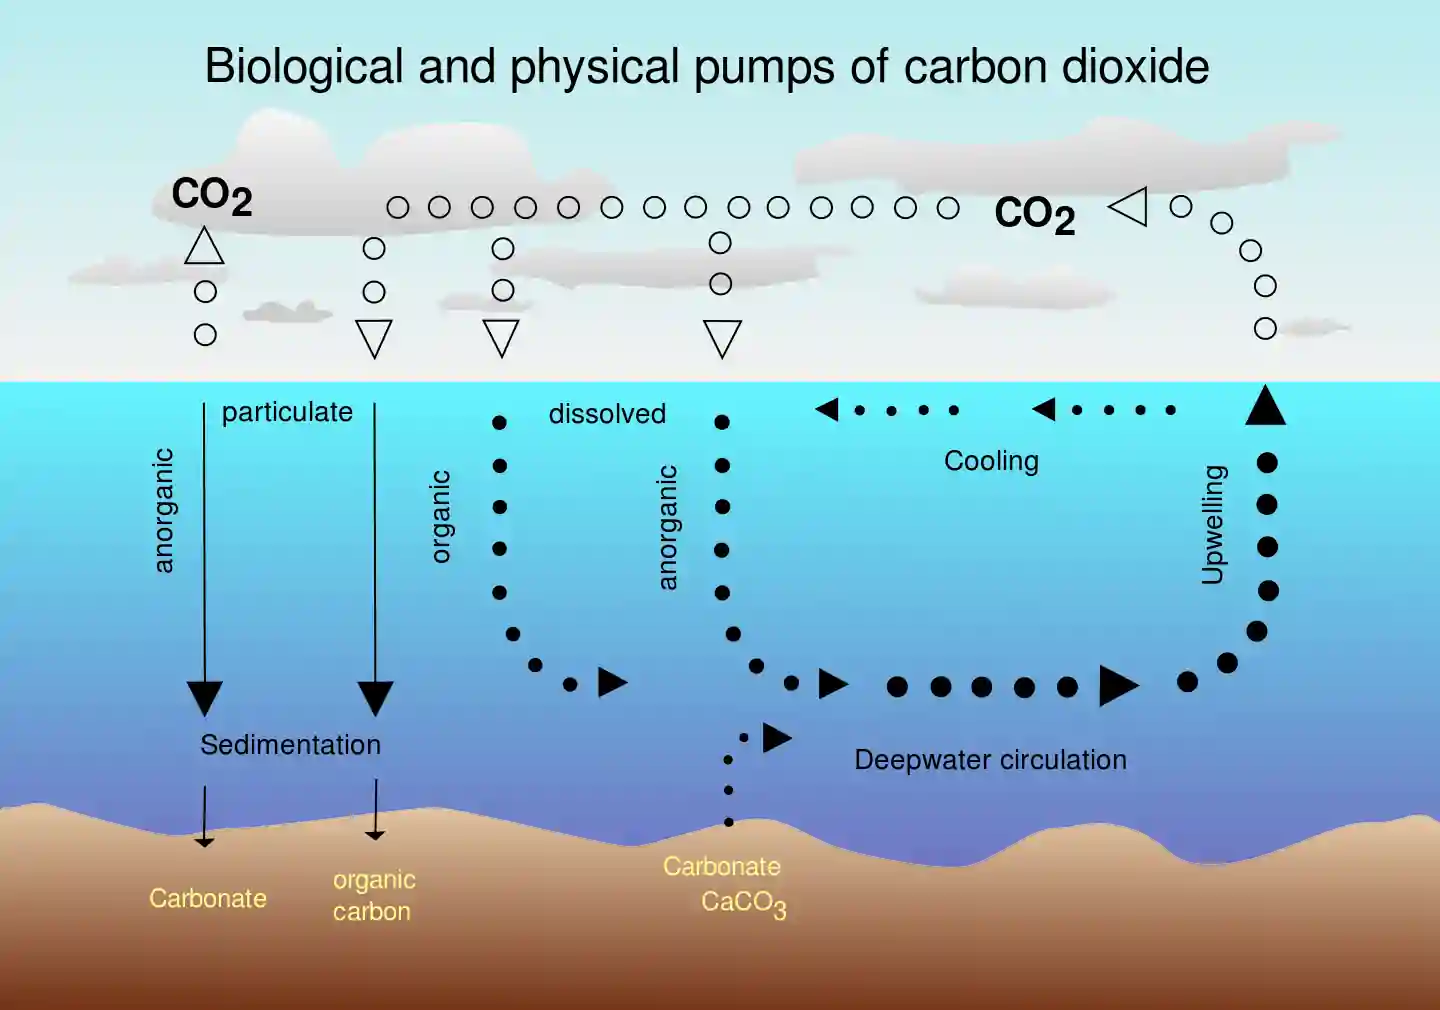
Ocean biology effects
The oceanic carbon cycle is harder to explain than the terrestrial cycle. Essentially, the ocean may be conceptually divided into a surface layer within which water makes frequent (daily to annual) contact with the atmosphere, and a deep layer below the typical mixed layer depth of fewer than a couple hundred metres, within which the time between this atmospheric contact may be centuries.
Carbon enters the ocean mainly through the dissolution of the carbon dioxide in the atmosphere. It can also enter the ocean through rivers, in the form of dissolved organic carbon—after which it is converted by organisms into organic carbon through photosynthesis and will either be exchanged throughout the food chain or move into the deeper, more carbon-rich layers as dead soft tissue or as calcium carbonate in the form of shells.
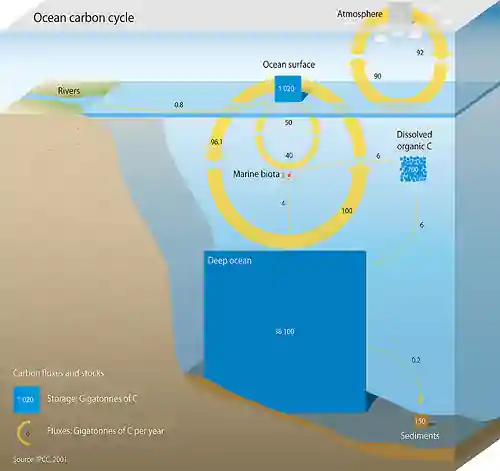
After circulating in this layer for a long time, this carbon will either be deposited as sediment or, eventually, returned to the surface waters. The oceanic absorption of CO2 is one of the most important forms of carbon sequestering (a process involved in the long-term storage of carbon) which assists in limiting the human-caused rise of carbon dioxide in the atmosphere.
However, this CO2 absorption makes water more acidic and affects ocean biosystems. This increasing rate of oceanic acidity, in a similar problem to that in the terrestrial cycle, could see the development of a feedback loop whereby the biological precipitation of calcium carbonates will decrease the ocean’s capacity to absorb carbon dioxide in the future.
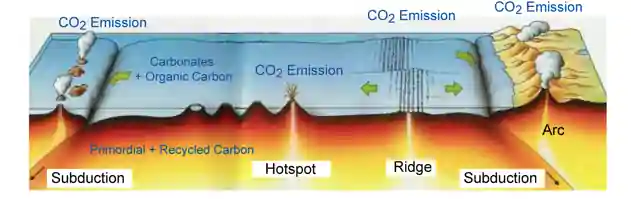
Deep carbon cycle
Finally, to tie these processes together, the deep carbon cycle will be discussed briefly. This cycle plays a critical role in maintaining carbon levels on Earth and transporting massive amounts of carbon into the planet.
Carbon primarily enters the Earth’s mantle in the form of carbonate-rich sediments on tectonic plates of ocean crust, which pull the carbon into the mantle upon undergoing subduction (see below):
Thus completes the exploration of the major components of the Earth’s energy cycle. Bringing all of these forms together, take a look at a simulation of the carbon cycle below, as it moves from Pre-Industrial to present day times:
Source: Twitter: Dr. Robert Rohde
In this final section on energy flows, I will address the final piece to the carbon cycle puzzle—fossil fuel emissions.
Fossil fuels
As we learned in the previous section, fossil fuels are typically fuels that are millions of years old, formed from natural processes, like the anaerobic decomposition of buried dead organisms we saw previously, containing energy originating in ancient photosynthesis; as such, these fuels contain high amounts of carbon and include petroleum, coal and natural gas.
Fossil fuels have become incredibly important in the Post-Industrial era, producing tremendous amounts of energy per unit of mass when burned. As we saw in the animation above, however, the consumption of these fuels is resulting in a greater output of CO2 emissions than the natural environment is able to absorb.
Warming
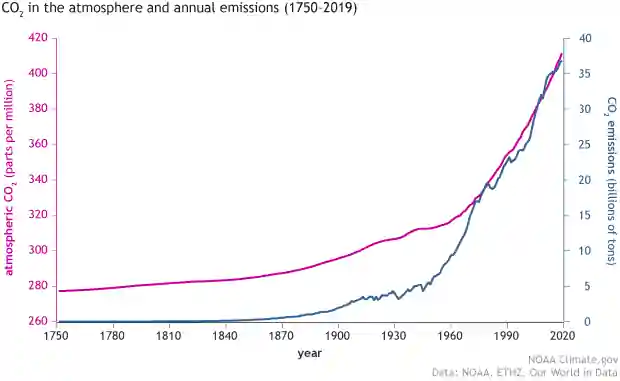
This increase in carbon emissions is directly correlated to an increase in temperature, evident in this graph from the EPICA Dome C in Antarctica modelling the temperature changes in relation to CO2 levels. Here, carbon dioxide is measured in terms of ppm, that is, a dimensionless measure of carbon dioxide as parts-per-million.
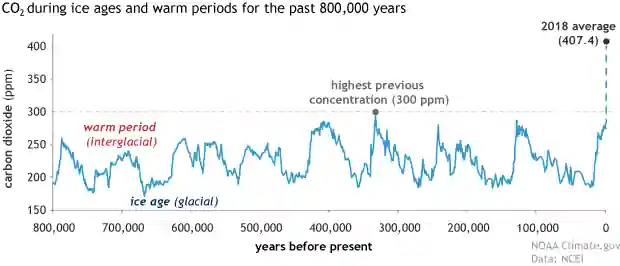
As you would expect, a greater consumption of one fuel source within a stable system, with (relatively) consistent energy flows in all other exchanges, will begin to produce negative externalities - the effect of which is a warming of the Earth. The figure below outlines the risks we are likely to encounter for selected natural, managed and human systems:
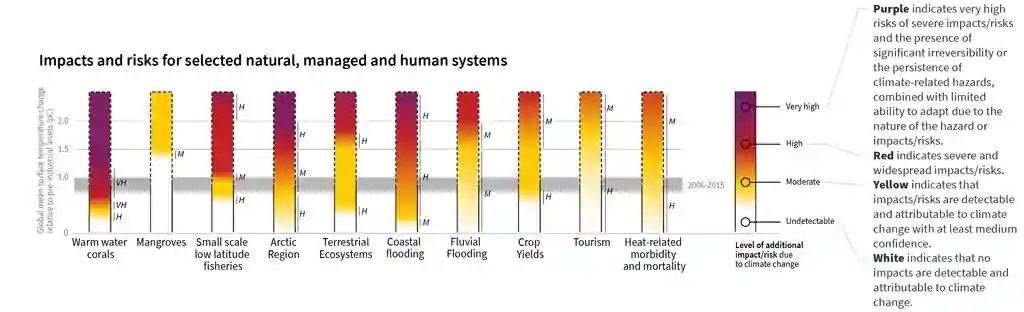
Seen below, we see a level of carbon dioxide rising in the modern era which will ultimately begin to affect the world in a number of ways; rising sea levels flooding coastal infrastructure, disruption of ecosystems around the world and even more extreme weather events.
So how is this warming being addressed? What are the proposed targets and how can technology serve to combat this issue? Let’s dive in.
Addressing the Issue
This section seeks to act as a bridge between the science of the climate and the technologies that are being developed to combat the warming of the globe. Please note that this section will primarily address the 2018 IPCC report, a document I deem to be the most pertinent climate knowledge we have at this point.
For many years, the default goal for reducing global warming was within 2 degrees Celsius (2C). However, in May 2015 the UN published a new report warning that the 2C limit was inadequate for avoiding some of the more severe impacts of climate change. Thus, a 2018 special report by the Intergovernmental Panel on Climate Change (IPCC) on the impact of global warming of 1.5C above pre-industrial levels was produced—the following sections break down the findings.
Timescale
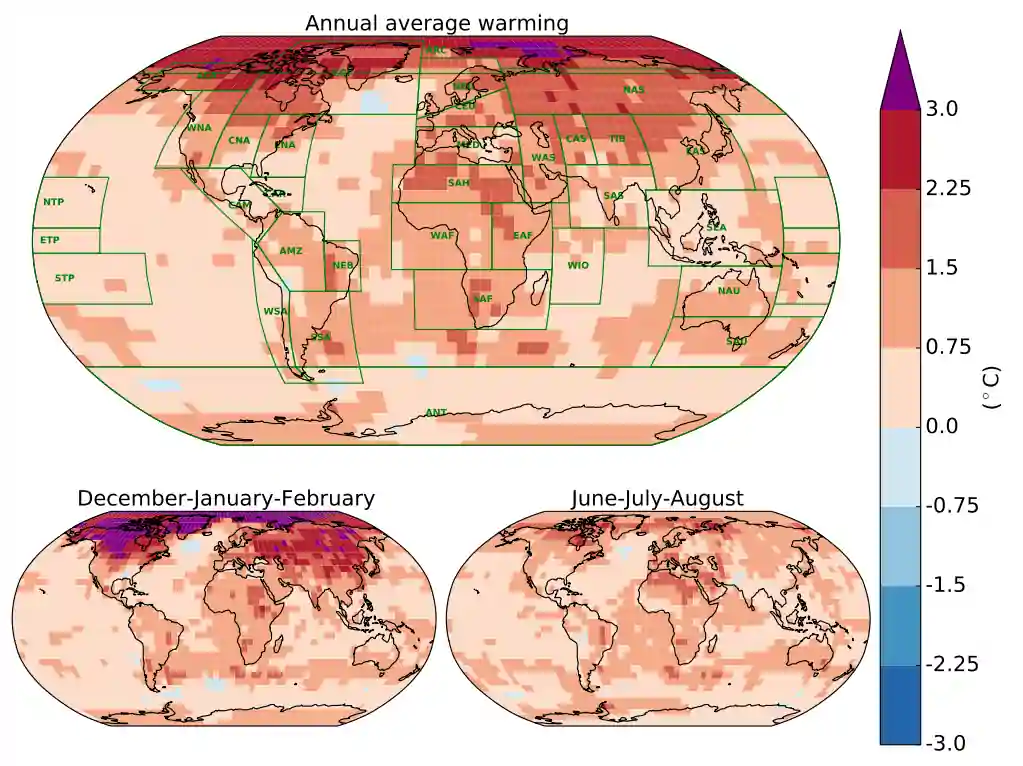
The average temperature of the globe has already warmed by around 1C since pre-industrial times (taken as 1850-1900 by the IPCC), with warming not consistent across the Earth’s surface; warming is generally higher over land than over the ocean and warming is two to three times higher in the Arctic.
In fact, 20-40% of the global population live in regions that have already experienced more than 1.5C of warming in at least one season. Below is a map showing regional warming (in 2006-2015) as an annual average and for the winter and summer seasons:
Currently, human-caused warming is adding around 0.2C to global average temperatures every decade, as the result of both “past and ongoing emissions”. If the rate remains constant, global warming is projected to reach 1.5C between 2030 and 2052.
As such, a number of pathways have been proposed in order to curb human emissions. Shown below is a model of the observed monthly temperatures (black line), estimated human-caused warming (red) and the idealised potential pathways to meeting the 1.5C limit in 2100 (grey, blue and purple).
Pathways
So we see in the figure above that there are a number of pathways that will limit warming to 1.5C. These pathways can be further broken down into two scenarios—the overshoot and stabilisation scenarios:
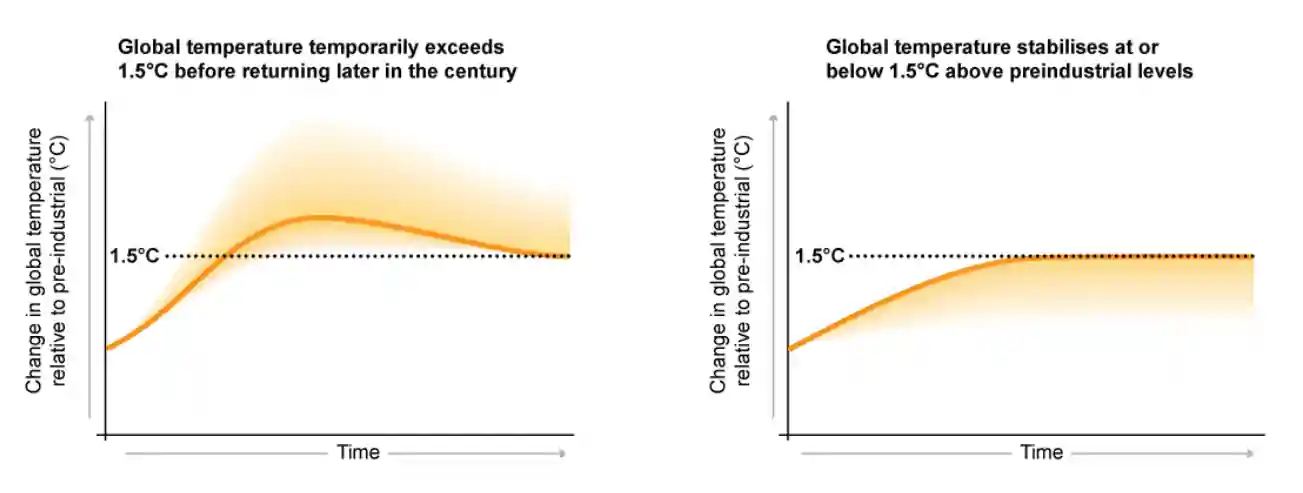
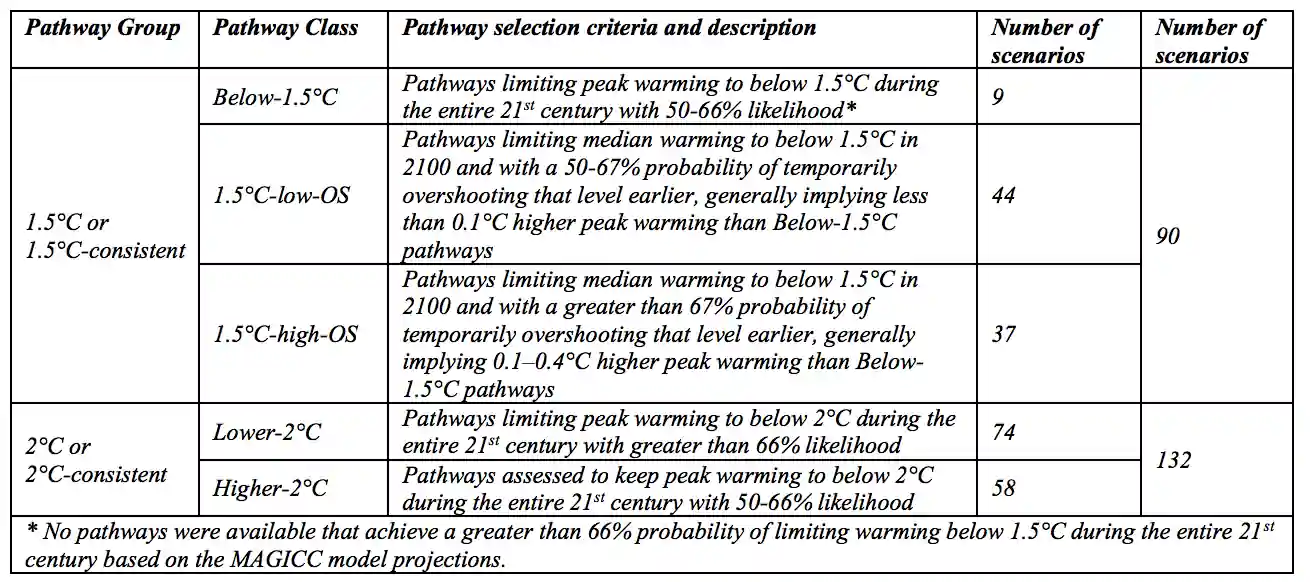
Below, the emissions scenarios are categorised based on how much they overshoot this 1.5C target. It is worth noting that only nine of the 91 1.5C scenarios stay below 1.5C for the entire 21st century. The other 81 all overshoot at some point:
In order to limit warming to 1.5C with “no or limited overshoot”, net global CO2 emissions need to fall by about 45% from 2010 levels by 2030 and reach “net zero” by around 2050.
This means that by halfway through the century, our CO2 emissions need to be matched by the CO2 we deliberately taken out of the atmosphere through negative emissions techniques, such as afforestation and bio-energy with carbon capture and storage (BECCS)—more on these exciting technologies to come.
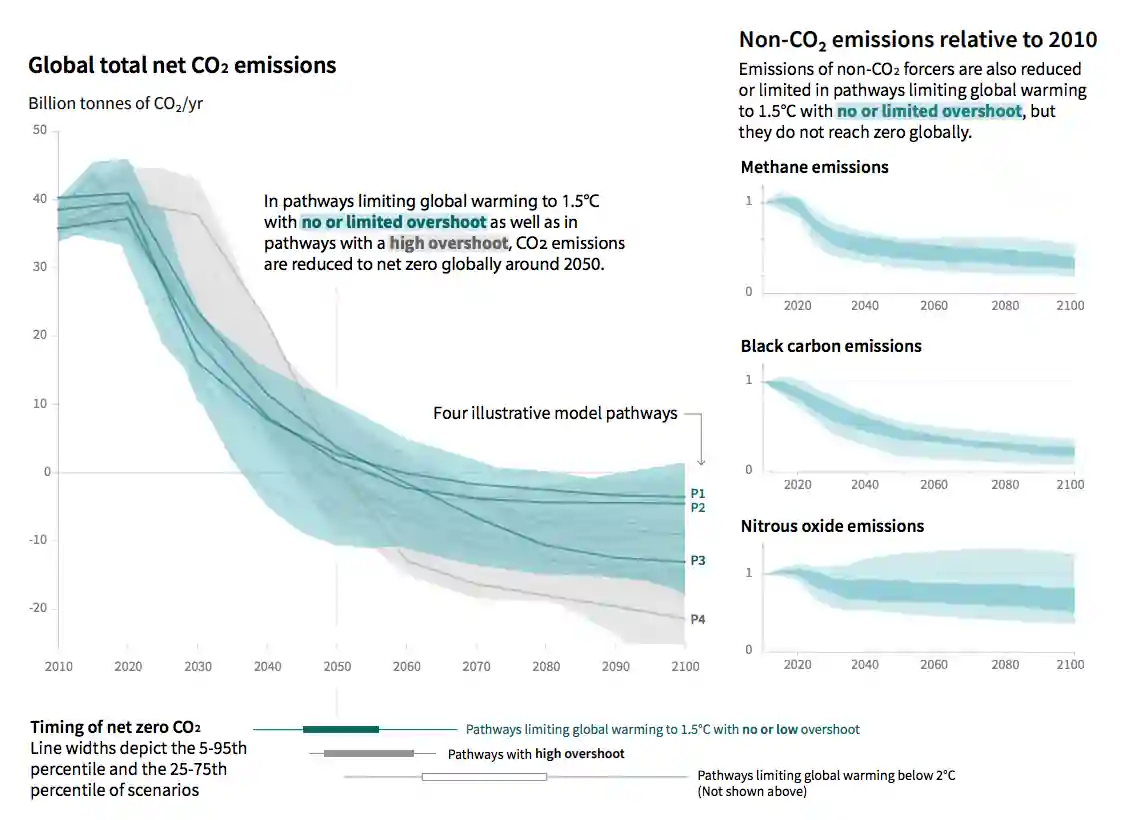
The below graphic illustrates how steeply CO2 emissions (left) and non-CO2 emissions (right) need to fall for 1.5C. The blue lines and shading show the pathways that meet the 1.5C limit with little (0-0.2C) or no overshoot, while the grey shows those where temperatures have a “high”" temporary overshoot before coming back down:
This will require "rapid and far-reaching transitions" across the global economy, including the transformation of the way energy is used and the sources it is derived from. The report continues:
“These systems transitions are unprecedented in terms of scale, but not necessarily in terms of speed, and imply deep emissions reductions in all sectors, a wide portfolio of mitigation options and a significant upscaling of investments in those options.”
The charts below illustrate the four illustrative model pathways identified in the figure above. On these charts, fossil fuels are shown in grey, yellow and brown show emissions reductions achieved by BECCS, and agriculture, forestry and other land use (AFOLU), respectively.
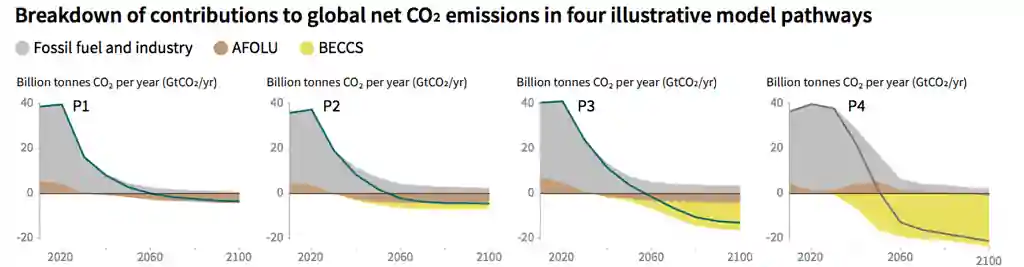
From carbonbrief.org: The P1 pathway assumes that the world rapidly reduces its fossil fuel emissions after 2020. This is largely achieved by reducing the global demand for energy, chiefly by switching to more energy-efficient technologies and behaviours. This pathway requires a relatively small amount of negative emissions, which is expected to be achieved via afforestation.
The P2 pathway also sees the world switch towards sustainable and healthy consumption patterns, low-carbon technology innovation, and well-managed land systems—this time with a limited amount of BECCS.
The P3 pathway is a “middle-of-the-road scenario” in which historical social and economic trends continue. Emissions reductions are mainly achieved by changing the way in which energy is produced and to a lesser degree by reductions in demand. This scenario requires a relatively large amount of BECCS.
The P4 pathway is a “resource and energy-intensive scenario”, which sees a growth in demand for high-energy products, such as air travel and meat. Emissions reductions are mainly achieved through BECCS.
(Pathways 1-3 see little-to-no overshoot of the 1.5C target, whereas P4 expects a high chance of overshoot). All pathways that limit warming to 1.5C with limited or no overshoot will require, in addition to the reduction of emissions, the use of negative emissions technologies or NETS, methods that remove CO2 from the atmosphere. This brings us to the final part of this essay - an exploration of energy-efficient technologies and behaviours which aim to achieve this 1.5C goal.
Climate Technologies and Geoengineering
Carbon Dioxide Removal (CDR) would be used to compensate for the residual emissions of human activities and, in most cases, achieve net negative emissions to return global warming to 1.5C following a peak.
From Stripe:
“Urgent global action is needed to halt greenhouse gas emissions, and it looks increasingly likely that in addition to emissions reduction, humanity will need to remove large amounts of carbon dioxide from the atmosphere. In its most recent summary report, the IPCC notes that most scenarios that stay below 2°C of temperature increase involve “substantial net negative emissions by 2100, on average around 2 gigatons of CO2 per year.”
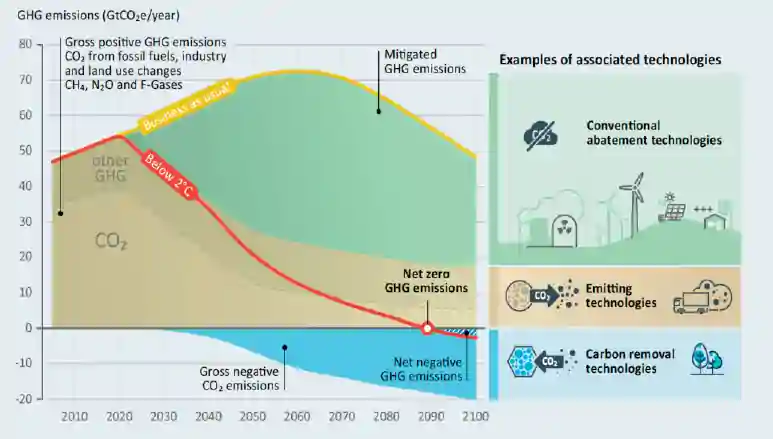
Although the picture below is for a 2C pathway, not 1.5C, the schematic is useful in demonstrating the key role that large-scale negative emissions technologies (in blue) will play, alongside the aggressive de-carbonisation (seen in brown):
From the book Radical Abundance: What makes climate change an unusually difficult problem (aside from the scale of its effects and the momentum of fossil fuel consumption) is the long-term persistence of CO2 in the atmosphere.
“Levels of atmospheric pollutants like soot or SO2 closely track the rate of emissions. Turn off the source and the pollutant soon washes out of the atmosphere. Even chlorofluorocarbons and methane have lifetimes measured in a small span of years.
CO2 is different. It exists the atmosphere on a timescale best measured in decades or centuries. Rain doesn’t scrub CO2 from the atmosphere; instead, CO2 is slowly absorbed, primarily by the seas. At any moment, CO2 levels are only slightly elevated by last year’s emissions and are instead the cumulative result of emissions that span the industrial era. Deep cuts in emissions wouldn’t lower CO2 levels in proportion, but would instead merely slow down the rate of their rise. The system behaves more like a bathtub with a drain that’s almost closed: If the tap is left open, the tub will eventually overflow.”
So not only might we have problems with the existing carbon levels in the atmosphere, sucking CO2 out of the atmosphere is going to require a large scale of technology with huge energy inputs or other resources and even then this may mean unique environmental issues when these technologies are deployed. Let’s first look at some of the fundamental energy and cost requirements of a process known as Direct Air Capture.
Direct air capture
For Carbon Dioxide Removal (CDR) to make a significant dent in the problem, this paper gives a reference for roughly how much carbon needs to be removed:
“…in the context of the Paris Agreement, useful reference values can be defined based on the difference between the 2 °C versus the 1.5 °C limits [...]: CDRref ≈ 650 Gt(CO2) for the cumulative CO2 budget, and RFGref ≈ 0.6 W/m^2 for the equivalent radiative forcing.”
So if CO2 removal methods can feasibly approach the removal of ~650 Giga-tonnes of CO2, which is ~177 Giga-tonnes of carbon (or ~83 ppm of atmospheric CO2) they will not fully return the atmosphere to pre-industrial levels but will certainly prove to be a useful benchmark for CDR success.
So how much energy is required to complete this type of work? Since this process is compressing a dilute gas, the following calculation produces the energy required:

More practically, we can calculate energy on a per mole of CO2 removed basis, with an energy cost for partial removal (since we only remove some CO2 from the atmosphere, not all of it) of:

And converting R (molar gas constant) to kilojoules per mole:

This is the fundamental energy requirement and should serve as a background behind how the numbers are calculated moving forward. With this thermodynamic limit in place, we can multiply this by a reasonable cost of energy per kJ.
Using a rough cost of energy of 5 cents per kilowatt-hour, we get $6 per tonne of CO2 removed. In practice, we aren’t close to this number (due to technological inefficiency and other aspects like the need to get enough air flow or the storage requirements of the CO2). This means that, in order to suck hundreds of giga-tonnes of CO2 out of the atmosphere, through this direct air capture approach, it will probably cost trillions—despite the thermodynamic and energy cost limits suggesting it could theoretically cost hundreds of billions.
Despite this, if we could go close to the thermodynamic limit (say, $10/tonne) we will get something like the following requirement:
$10/t x 650Gt = $6.5 Trillion over 10 years = $650 Billion / year
This is less than 1% of the world GDP of approximately $80 trillion.
Remember that this technology is not instant and we do have to account for the extent to which fast-acting natural CO2 sinks can turn into fast-acting natural sources in a period of declining CO2. This would also be a fairly slow process since it would take a lot of time and energy to build the infrastructure, which would only suck the carbon out a (relatively) small amount at a time.
Let’s turn our attention now to Albedo Modification, or solar radiation management (SRM).
Albedo modification
Remember this equation from the start of this post?
Recall that Earth’s Albedo (α) ≈ 0.30, the measure of reflection of solar radiation. The idea behind this family of technology is that we can attempt to increase this number in order to prevent some incoming solar radiation from making it to the ground.
To theoretically change the albedo in order to achieve a temperature reduction, many geoengineering papers have suggested lowering the incoming solar radiation by about 1.8% would result in cooling of around 1.6 Kelvins (or degrees Celsius).
Earth’s surface reflects this solar radiation from clouds, air, dust and haze while another significant portion of incoming radiation (approx. 22%) is absorbed by the water, dust, haze and clouds of the atmosphere; some of this being re-radiated back to space without ever interacting at the surface. As a result, a “small increase in the atmospheric backscatter could have a sizeable impact on the atmospheric energy balance”. This is where the field has focused the efforts thus far.
A seminal paper offers a number of ways to do this:
- Particles in the upper atmosphere which would back-scatter some of the incoming sunlight
- Particles in near-Earth orbit which would back-scatter some of the incoming sunlight
- A structure in space between the Earth and sun which would deflect a fraction of the incoming sunlight through a small angle such that it would miss the Earth
Of these three options, the field seems to have focused heavily on option number 1, for reasons they outlined; basically, this approach is cheap and needs to be replenished on a timescale of less than a decade, so naturally disposes of itself if you want to remove it on that timescale.
The idea is ultimately to replicate the atmospheric effect of an event like the eruption of Mount Pinatubo in the Philippines (1991), which actually reduced the average global temperature by about half a degree for a few years:
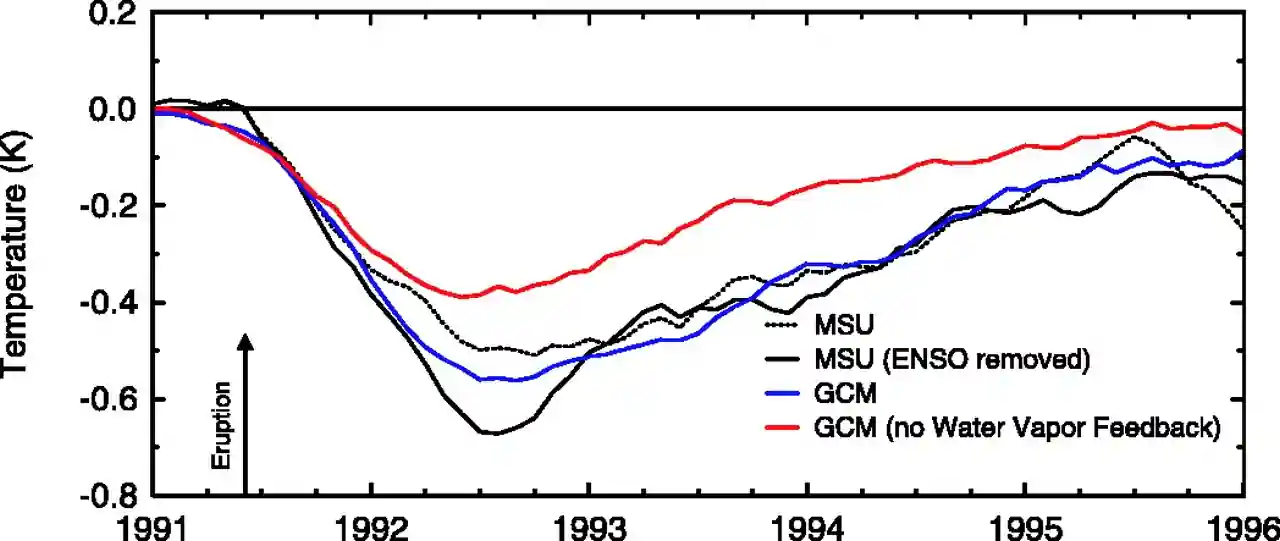
Unfortunately, the upper atmosphere is very complex and there are a number of concerns including the fact that the particles do not solve ocean acidification, cause changes in precipitation, impact different areas differently and it may not fully mitigate sea ice. Regardless, this technology is worth continual research and experimentation.
In terms of modification of the Earth’s surface, one project which aims to address this is Pleistocene Park; Siberia used to be grassland and today is mostly forest. These forests don’t reflect a lot of solar radiation and a treeless, grassy Siberia would increase Earth’s albedo. Forests absorb more solar radiation and put it into the ground as heat. Forests also reduce the population of snow-trampling grazing populations of animals that ordinarily trample the snow, reducing its insulating properties and allowing permafrost below to hard freeze.
The thawing of this permafrost could therefore be a tipping point, leading to significantly more carbon as the microbes within the soil come to life, eat, reproduce and start generating carbon emissions. In addition to the reintroduction of grazing herds such as bison, moose, wild horses, yaks and reindeer; the project aims to bring back woolly mammoths by adding genes like more fat, thicker hair and smaller ears to Asian elephants (the mammoths’ closest living relative).
Wildly ambitious but very interesting, both of these approaches to solar engineering could prove to make a huge difference in combating the Earth’s warming problem.
Carbon-silicate cycle
We talked about this cycle earlier in the Ocean Biology Effects cycle, part of Earth’s built-in geological system for removing CO2. Project Vesta has proposed taking advantage of this cycle by mining large volumes of a (usually) green mineral called olivine, crushing it up, and spread the resulting green sand on beaches all over the world, especially in the tropics where the water is warmest.
Tumbled in warm, fast-moving water, this green sand would rapidly weather, essentially undergoing millions of years of the natural carbonate-silicate cycle in a few months or years.
In terms of the pricing - from elidourado.com
“Logistically, the plan seems at least plausible. One ton of olivine applied in Vesta’s process removes around 1.25 tons of CO₂ from the atmosphere. Olivine is superabundant, making up about half of Earth’s upper mantle, and currently costs around $25/ton to mine. At greater mining scale, mining and crushing olivine could be done for around $7/ton. Add around $3/ton for transport and logistics and you still have 1.25 tons of CO₂ removed from the atmosphere for about $10, or $10.62 as the detailed Project Vesta model has it. The Vesta team admits that a full life cycle analysis would lose up to 6% of the CO₂ saved, due to mining, milling, and transport. Even so, that works out to around $9.04 per ton of CO₂ removed from the atmosphere and ocean.”
At this pricing, removing the global annual level of CO2 emissions (40Gt of CO2) will cost around $360 billion. A lot of money but certainly achievable (0.4% of global GDP). A one-time cost of 15.18 trillion would theoretically offset all human emissions since the dawn of the industrial revolution which, if done over 10 years, would cost 1.7% of global GDP. Interesting right?
Conclusion
I hope that this essay has served as a fairly useful point to dip your toe into understanding how the Earth’s energy processes function and the role that technology can play in seeking to mitigate the effects of human emissions and the associated energy imbalance this is bringing to the planet.
Personally, I am optimistic about the role of innovative technological advancements in combating climate change and believe that radical changes will occur once the cost of these technologies is at the point where sufficiently-beneficial incentive structures will reward such innovation and implementation of new technologies (the climate technology sector, to me, looks set to be enormous business in the next few decades).
Wrapping up, it is worthwhile noting again that I have deliberately avoided any research into the crucial political and policy aspects, like a carbon tax. This is not to imply that a unilaterally technological approach is suggested, only that I do not have the understanding (or willingness to learn) this aspect of the problem at this point.
Thank you for reading.
References
- Carbon Brief. (2019). In-depth Q&A: The IPCC’s special report on climate change at 1.5C | Carbon Brief. [online] Available at: https://www.carbonbrief.org/in-depth-qa-ipccs-special-report-on-climate-change-at-one-point-five-c.
- Climate.gov. (2000). Climate Change: Atmospheric Carbon Dioxide | NOAA Climate.gov. [online] Available at: https://www.climate.gov/news-features/understanding-climate/climate-change-atmospheric-carbon-dioxide.
- Dourado, E. (2019). The dawn of the age of geoengineering. [online] Available at: https://elidourado.com.
- Longitudinal Science. (2019). Available at: https://longitudinal.blog.
- Negative Emissions Technologies and Reliable Sequestration. (2019). [online] Washington, D.C.: National Academies Press. Available at: https://www.nap.edu/read/25259/chapter/2#3.
- Soden, B.J. (2002). Global Cooling After the Eruption of Mount Pinatubo: A Test of Climate Feedback by Water Vapor. Science, [online] 296(5568), pp.727–730. Available at: http://science.sciencemag.org/content/296/5568/727.
- Stripe.com. (2019). Stripe. [online] Available at: https://stripe.com/gb/blog/negative-emissions-commitment.
- Wikipedia Contributors (2019a). Autotroph. [online] Wikipedia. Available at: https://en.wikipedia.org/wiki/Autotroph.
- Wikipedia Contributors (2019b). Carbon cycle. [online] Wikipedia. Available at: https://en.wikipedia.org/wiki/Carbon_cycle.
- Wikipedia Contributors (2019c). Carbon dioxide in Earth’s atmosphere. [online] Wikipedia. Available at: https://en.wikipedia.org/wiki/Carbon_dioxide_in_Earth%27s_atmosphere.
- Wikipedia Contributors (2019d). Fossil fuel. [online] Wikipedia. Available at: https://en.wikipedia.org/wiki/Fossil_fuel.
- Wikipedia Contributors (2019e). Global warming. [online] Wikipedia. Available at: https://en.wikipedia.org/wiki/Global_warming.
- Wikipedia Contributors (2019f). Oceanic carbon cycle. [online] Wikipedia. Available at: https://en.wikipedia.org/wiki/Oceanic_carbon_cycle.
- Wikipedia Contributors (2019g). Terrestrial biological carbon cycle. [online] Wikipedia. Available at: https://en.wikipedia.org/wiki/Terrestrial_biological_carbon_cycle.